Work tools
Research Terminal
A workspace for market research, with the data and calculations behind each explanation close at hand.
Research Terminal brings asset comparisons, watchlists, portfolios, news, and generated commentary into one workspace. I want to be able to read an explanation of a market move and then look at what it was based on.
Comparing two assets starts with their prices, but it also needs consistent calculations. The analytics engine computes returns and risk measures from the supplied data. A model receives those results and supporting context to write commentary. The inputs remain available to inspect.
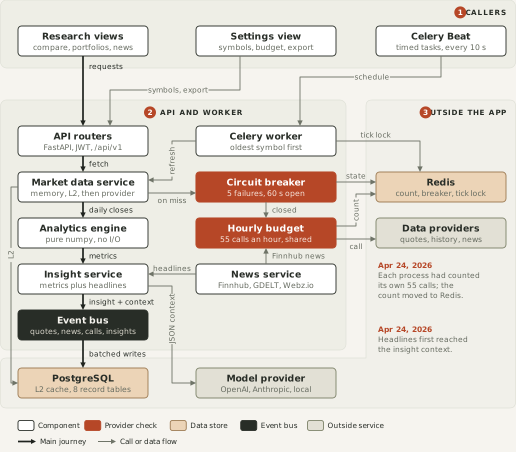
Behind the charts, providers update at different times and limit how often they can be called. The data system saves observations, caches repeated reads, and shares request budgets between the API and background workers. It keeps the connections between prices, fundamentals, calculations, news, and explanations for later inspection and export.
A background-worker version of the backend is in development.
How it works / Explore the workflow
From market data to commentary
The API and background worker share a cache and provider budget. The analytics engine calculates metrics from the data it receives. Those metrics and supporting context go to a model, and the explanation is saved with the inputs used to write it.
Learnings
Data has an age whether the interface shows it or not. A price from last week may be useful for one question and useless for another. Caching keeps a research tool available when a provider is slow or a request budget runs out, but it also makes old observations easy to mistake for new ones. The date belongs with the value, where the reader is making the comparison.
Freshness becomes a shared problem once several workers fetch data. A request limit held in each process multiplies with the number of processes. The provider still has one allowance for the account. Coordinating that budget requires the workers to share what they have spent and when they should stop.
Generated commentary adds another dependency: the model needs the material the explanation claims to use. A prompt asking it to consider headlines did not mean headlines had reached it. Saving the actual inputs alongside the explanation makes that question answerable. It also lets a reader inspect the gap between what the data says and what the model made of it.